Here is a helpsheet that I created on the topic of Domain and Range of Inverse Functions, a topic no longer in O Levels but still in IP Math.
Featured Book:

Here is a helpsheet that I created on the topic of Domain and Range of Inverse Functions, a topic no longer in O Levels but still in IP Math.
Featured Book:
In this post, we will discuss how to sketch the graphs of 
First, we will look at Quadratic Graphs (
If a>0, the graph is a “U” shape or “happy face”. 🙂
If a<0, the graph is a “n” shape or “sad face”. 😦

 (take out common factor of
  )
) (Key step: Divide coefficient of x by 2, add & subtract the square of it)
 into your initial and final answer)
* (p,q) is the turning point of the graph
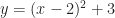
For example,

Minimum pt: (2,3)
 , where a>0 (Volcano shape)
Not touching the x-axis (Asymptote)

If a<0, the graph becomes upside down.

(
 , where a>0. (Hyperbola, Slanted Hourglass)
If a<0, it will be upside down (reflected about x-axis)
 (
(