Motivation
Data is commonly represented as an unordered sequence of points in the Euclidean space  . The global `shape’ of the data may provide important information about the underlying phenomena of the data.
For data points in  , determining the global structure is not difficult, but for data in higher dimensions, a planar projection can be hard to decipher.
From point cloud data to simplicial complexes
To convert a collection of points  in a metric space into a global object, one can use the points as the vertices of a graph whose edges are determined by proximity (vertices within some chosen distance
  ). Then, one completes the graph to a simplicial complex. Two of the most natural methods for doing so are as follows:
Given a set of points in Euclidean space , the Cech complex (also known as the nerve),  , is the abstract simplicial complex where a set of
  vertices spans a
  -simplex whenever the corresponding closed
  -ball neighborhoods have nonempty intersection.
Given a set of points in Euclidean space , the Vietoris-Rips complex,  , is the abstract simplicial complex where a set
  of vertices spans a -simplex whenever the distance between any pair of points in is at most .

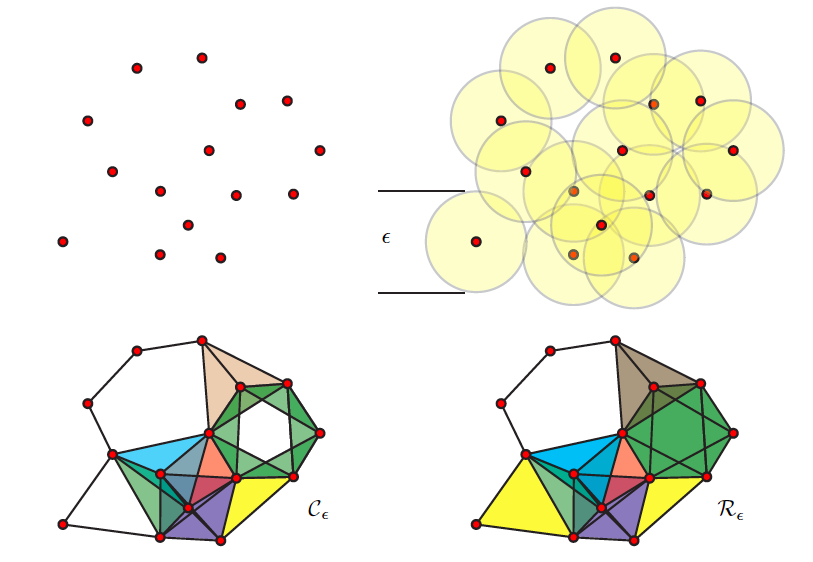
Top left: A fixed set of points. Top right: Closed balls of radius centered at the points. Bottom left: Cech complex has the homotopy type of the cover ( ) Bottom right: Vietoris-Rips complex has a different homotopy type (
 ). Image from R. Ghrist, 2008, Barcodes: The Persistent Topology of Data.


You can make the math symbols bigger than the text font for easy reading. eg.
“&s=3” added after the last } tells latex to make the symbol lambda bigger at size 3 (which is slightly bigger than the text font, so it stands out).
LikeLike
Sorry, latex should be: “.
“.
“
For color, you can append behind “&fg=aa0000 ” (brown)
LikeLike